Real-time Analytics
Metrics and performance data for Le Git Graph - Commits Graph for GitHub
Timeframe:
Advanced Analytics
Monthly Growth
Percentage change in user base over the last 30 days compared to previous period
Category Ranking
Current position ranking within the extension category compared to competitors
Install Velocity
Average number of new installations per week based on recent growth trends
Performance Score
Composite score based on rating, review engagement, and user adoption metrics
Version Analytics
Update frequency pattern and time since last version release
Performance Trends
Analytics data over time for Le Git Graph - Commits Graph for GitHub
Loading analytics data...
About This Extension
A browser extension that displays the git graph for any GitHub repository.
Calling all GitHub enthusiasts! Elevate your coding prowess with our exceptional browser extension, "Le Git Graph" – the ultimate tool that transforms your GitHub journey into a captivating visual spectacle.
🚀 Embrace Visual Clarity:
Integrating seamlessly into the GitHub website, "Le Git Graph" introduces a dynamic and interactive Git graph to your repositories. No more deciphering complex commit logs or struggling to make sense of intricate branching patterns. This extension unveils your version control history in a striking, user-friendly graph, making project navigation an absolute breeze.
🎨 A Work of Art:
Behold the mesmerizing visual representation of your Git history with "Le Git Graph." Witness branches, merges, and commits come to life in an organized and aesthetically pleasing manner. Analyze project progress, identify code changes, and make informed decisions with unparalleled ease.
🔍 Intuitive Exploration:
Experience GitHub navigation like never before! "Le Git Graph" empowers you to explore branches effortlessly, delve into commits, and seamlessly switch between versions. Uncover hidden relationships between code changes and gain valuable insights with just a few clicks.
🛠️ Empower Collaboration:
Take collaboration to new heights! "Le Git Graph" facilitates seamless code reviews, efficient conflict resolution, and effective communication among team members. Boost productivity and build remarkable projects together, all while enjoying the delightful visual experience.
⚙️ Hassle-Free Setup:
Getting started is a breeze! Download "Le Git Graph" from your browser store, and instantly elevate your GitHub interface with this powerful extension. Lightweight, dependable, and compatible with major browsers, it ensures a smooth coding journey from the get-go.
⭐ Embrace the Revolution:
Step into the future of GitHub collaboration and unleash the true potential of your repositories with "Le Git Graph" extension. Experience coding productivity like never before!
👉 Don't miss out on this game-changing tool – download "Le Git Graph" now and embark on an awe-inspiring coding adventure! Happy coding!
#GitHub #GitGraph #LeGitGraph #BrowserExtension #CodeVisualization #DeveloperTools #CodingJourney #ProductivityHacks #OpenSource
Screenshots
1 of 5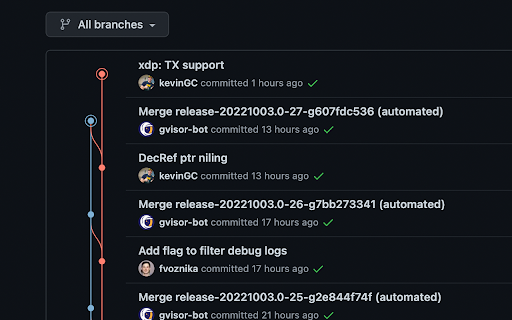
Technical Information
- Size
- 813KiB
- Languages
- 1 supported
- Extension ID
- joggkdfebigd...
Links & Resources
Version History
1.3.5
Current Version
Latest
05/05/2025
1.3.4
Previous Version
04/05/2025
1.3.3
Older Version
03/06/2025
Related Extensions
Similar extensions in Workflow & Planning
Adobe Acrobat: PDF edit, convert, sign tools
by Adobe, Inc.
Workflow & Planning
Do more in Google Chrome with Adobe Acrobat PDF tools. View, fill, comment, sign, and try convert and compress tools.
327.0M
4.4
60.9K
Nov 5
View Analytics
Vimeo Record - Screen & Webcam Recorder
by Vimeo
Workflow & Planning
Record and share free video messages from your browser
200.0M
4.5
1.7K
Oct 19
View Analytics
AdBlock — block ads across the web
by ADBLOCK, INC.
Workflow & Planning
Block ads on YouTube and your favorite sites for free
61.0M
4.5
290.5K
Oct 30
View Analytics