Real-time Analytics
Metrics and performance data for htmx-debugger
Timeframe:
Advanced Analytics
Monthly Growth
Percentage change in user base over the last 30 days compared to previous period
Category Ranking
Current position ranking within the extension category compared to competitors
Install Velocity
Average number of new installations per week based on recent growth trends
Performance Score
Composite score based on rating, review engagement, and user adoption metrics
Version Analytics
Update frequency pattern and time since last version release
Performance Trends
Analytics data over time for htmx-debugger
Loading analytics data...
About This Extension
htmx-debugger - a debugging tool for htmx applications
## Overview
htmx-debugger is a powerful browser extension (compatible with Chrome and Firefox) designed to help developers debug and analyze htmx applications. It provides a comprehensive and user-friendly interface for viewing htmx events, requests, and responses in real-time. This tool is essential for understanding and troubleshooting htmx-powered web applications, making the development process smoother and more efficient.
## Features
- Real-time capture and display of htmx events
- Intelligent grouping of related events for easier analysis
- Powerful search functionality to filter events
- One-click clear button to reset the debugger view
- Flexible event filtering (All, Request, Response)
- Collapsible event details for a cleaner interface
- Detailed timing information for request-response cycles
- Live connection status indicator
- Automatic periodic connection checks for improved stability
- Robust error handling and reporting
## Future
- Export functionality to save captured events as a JSON file
- Import capability to load and analyze events from a JSON file
## Usage
### Opening the Debugger
1. Navigate to a webpage that uses htmx.
2. Open Chrome DevTools (Right-click > Inspect or press F12).
3. Look for the "htmx" tab in the DevTools panel. If you don't see it, click on the ">>" icon to find it in the list of additional tools.
### Debugging htmx Events
The debugger automatically captures htmx events as they occur on the page. Each event is displayed with the following information:
- Event type
- Timestamp
- Target element details
- Event-specific details
- XHR information (for relevant events)
### Using the Debugger Features
1. **Connection Status**: Check the connection status indicator in the panel header to ensure the debugger is properly connected.
2. **Search**: Use the search bar at the top to filter events based on their content.
3. **Clear**: Click the "Clear" button to reset the debugger and remove all captured events.
4. **Event Filtering**: Use the filter buttons to show all events, only requests, or only responses.
5. **Expand/Collapse**: Click on an event header to expand or collapse its details.
6. **Timing Information**: For grouped events, the total duration is displayed at the bottom of the group.
## Troubleshooting
- If you don't see any events in the debugger, ensure that the webpage you're debugging is actually using htmx.
- If the htmx tab doesn't appear in DevTools, try reloading the page or reopening DevTools.
- Check the browser console for any error messages related to the extension.
- If the connection status shows "Disconnected", try reloading the page.
- If problems persist, try disabling and re-enabling the extension, reloading the webpage, or restarting Chrome.
## Privacy Policy
htmx-debugger is committed to protecting user privacy and does not collect or use any personal user data. The extension operates solely within the context of the user's browser to provide debugging functionality for htmx applications.
### Permissions and Their Justifications
1. **alarms**: The alarms permission is used to schedule periodic connection checks, ensuring the debugger maintains a stable connection to the webpage. This improves the reliability of the debugging process.
### Single Purpose Description
The single purpose of htmx-debugger is to provide a comprehensive debugging tool for web developers working with htmx-powered applications. It captures, displays, and analyzes htmx events in real-time, offering insights into the behavior and performance of htmx interactions within web pages.
### Data Usage Compliance
htmx-debugger complies with the Chrome Web Store Developer Program Policies regarding data usage. The extension:
- Does not collect any personal user data
- Does not transmit any captured debugging information outside of the user's browser
- Only processes information necessary for its core debugging functionality
- Stores data locally and solely for the purpose of improving the user's debugging experience
By using htmx-debugger, users can be assured that their privacy is respected and that the extension operates within the bounds of its stated purpose as a development tool for htmx applications.
Screenshots
1 of 2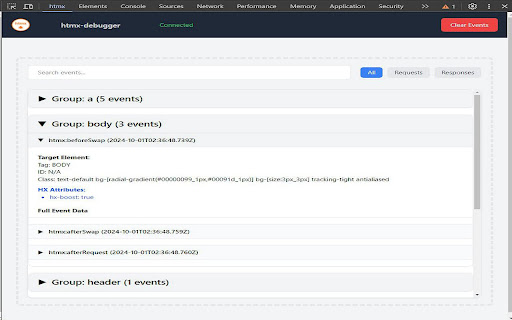
Technical Information
- Size
- 71.28KiB
- Languages
- 1 supported
- Extension ID
- fkpjmdhppdad...
Version History
1.0.6
Current Version
Latest
10/22/2024
1.0.5
Previous Version
09/22/2024
1.0.4
Older Version
08/23/2024
Related Extensions
Similar extensions in Developer Tools
GoFullPage - Full Page Screen Capture
by Full Page LLC
Developer Tools
Capture a screenshot of your current page in entirety and reliably—without requesting any extra permissions!
10.0M
4.9
82.6K
Mar 22
View Analytics
TouchEn PC보안 확장
by 라온시큐어
Developer Tools
브라우저에서 라온시큐어의 PC보안 기능을 사용하기 위한 확장 프로그램입니다.
9.0M
1.3
6.2K
May 23
View Analytics
React Developer Tools
by Meta
Developer Tools
Adds React debugging tools to the Chrome Developer Tools.
Created from revision 3cde211b0c on 10/20/2025.
5.0M
4.0
1.6K
Oct 21
View Analytics