Real-time Analytics
Metrics and performance data for Bar Graph Maker
Timeframe:
Advanced Analytics
Monthly Growth
Percentage change in user base over the last 30 days compared to previous period
Category Ranking
Current position ranking within the extension category compared to competitors
Install Velocity
Average number of new installations per week based on recent growth trends
Performance Score
Composite score based on rating, review engagement, and user adoption metrics
Version Analytics
Update frequency pattern and time since last version release
Performance Trends
Analytics data over time for Bar Graph Maker
Loading analytics data...
About This Extension
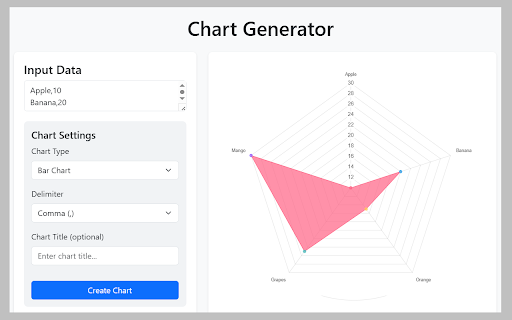
Use Bar Graph Maker for create chart in seconds — the ultimate Bar Graph generator for quick data visualization.
Bar Graph Maker – Create Stunning Bar Graphs Instantly 📊
Bar Graph Maker is your go-to diagram creator for crafting professional, clear, and customizable bar graphs in seconds.
Designed for students, teachers, data analysts, and business professionals, this tool helps you make a bar graph online with zero hassle.
If you've ever asked yourself how to make a diagram, this extension gives you the answer instantly. It's the fastest way to create a graph that gets your point across, no technical skills required.
🎯 Why Bar Graph Maker?
1️⃣ Create high-quality diagram in seconds
2️⃣ Choose from simple, stacked, or double bar chart layouts
3️⃣ Export visuals for reports, websites, and slide decks
4️⃣ Edit colors, labels, legends, and axes
5️⃣ 100% browser-based bar graph maker
Now you can stop searching how do you make a bar graph in Excel or how to make stacked diagram.
This tool provides everything you need in one place — a powerful, flexible diagram maker right at your fingertips.
📊 Built-in Tools Include:
✅ Bar graph generator
✅ Line chart maker
✅ Pie chart generator
✅ Box and whisker plot generator
✅ Chart creator for all your data needs
This is more than just a bar chart generator. Use it as a complete diagram chart and diagram creator to support your data storytelling.
📌 Create Many Types of Charts:
❗️ Vertical and horizontal bar charts
❗️ Grouped and stacked bar graphs
❗️ Simple and interactive line graphs
❗️ Informative circle graphs and pie diagrams
❗️ Box plots and data charts for statistics
Use it as your go-to graph creator or math graph visualizer.
Ideal for creating school projects, marketing dashboards, or financial comparisons.
🧩 Make Your Diagram Shine:
• Add titles, labels, legends, and tooltips
• Switch between column chart maker and diagram styles
• Compare multiple datasets with double bar graph maker
• Customize axes and colors
• Export to PNG, JPG, or PDF
Whether you're figuring out how to make a bar chart for data collection or need to plot a diagram for a class project, this bar chart creator makes it effortless.
📌 Ideal For:
• Educators and students learning about types of graphs
• Professionals making diagram for business use
• Anyone looking for a fast diagram creator
• Users tired of struggling with Excel or other bulky tools
📚 Tired of asking...
❔ How to make a bar chart in Excel?
❔ How to make bar chart in Google Sheets?
❔ How do I create a diagram in PowerPoint or Word?
❔ Just use this bar graph maker free and keep it simple!
📌 Bonus Learning Tools Included:
❓ how to make a bar graph?
❓ how to make a pie chart?
❓ how to make a graph in Google Sheets?
❓ how to make pie chart excel?
📌 Use Diagram Maker As:
• Bar graph maker in Excel alternative
• Box and whisker plot maker
• Pie chart maker or circle chart maker
• Bar chart maker for business
• Infographic generator
📌 Ways to Use Diagram Maker:
☝️ Analyze monthly sales for management reports
☝️ Visualize survey and questionnaire results
☝️ Compare product or service performance
☝️ Prepare educational materials and assignments for students
☝️ Display statistics and data for marketing campaigns
💡 Why Users Love It:
▸ Easy drag-and-drop controls
▸ No design skills needed
▸ Works offline and online
▸ Ideal for presentations, education, and reports
🆕 Top Use Cases for Graph Maker:
➤ Visualize survey results
➤ Compare product performance
➤ Track monthly KPIs
➤ Build classroom worksheets
➤ Design data-driven infographics
With Diagram Maker, you're equipped to build sleek, accurate, and beautiful barcharts that tell your data’s story. No more clunky spreadsheets or confusing interfaces — just a clean, responsive diagram maker experience.
Install now and discover how easy it is to make a diagram, chart data, and bring your numbers to life with the best bar chart generator on Chrome.
Screenshots
1 of 4
Technical Information
- Size
- 194KiB
- Languages
- 20 supported
- Extension ID
- ibcjbgbkonnl...
Version History
1.0.0
Current Version
Latest
04/21/2025
1.0.-1
Previous Version
03/22/2025
1.0.-2
Older Version
02/20/2025
Related Extensions
Similar extensions in Tools
GoFullPage - Full Page Screen Capture
by Full Page LLC
Developer Tools
Capture a screenshot of your current page in entirety and reliably—without requesting any extra permissions!
10.0M
4.9
82.5K
Mar 23
View Analytics
TouchEn PC보안 확장
by 라온시큐어
Developer Tools
브라우저에서 라온시큐어의 PC보안 기능을 사용하기 위한 확장 프로그램입니다.
9.0M
1.3
6.2K
May 23
View Analytics
WPS PDF - Read, Edit, Fill, Convert, and AI Chat PDF with Ease
by www.wps.com
Tools
Easy-to-use PDF tools to view, edit, convert, fill, e-sign PDF files, and more in your browser.
8.0M
4.5
146
Sep 29
View Analytics